Automated Diagrams and Documentation
- date:
2010-04-09 15:07
- author:
admin
- category:
documentation, general, python
- tags:
automation, diagrams, documentation, python, shapely
- slug:
automated-diagrams-and-documentation
- status:
published
As I previously wrote, one of the ways to get through the task of documenting a project is to turn the documentation process into a coding project. Documentation sometimes seems pointless as the likelihood of anyone other than yourself reading it are low to nil.
To increase the chances pretty pictures always help. If they are also useful then the documentation starts to have real value. Up until now I’ve been using Microsoft’s Visio, but recently I tried out a couple of online tools.
Class Diagrams
The MapServer Mapscript documentation currently uses of diagrams made from ASCII text to illustrate relationships between classes. I’m not sure if these were generated automatically, but the images now appear a little dated. They do however have the advantage over an image of being able to copy and paste class names.
+-------+ 0..*     1 +-------+
| Class | <--------> | Layer |
+-------+            +-------+
I tried to recreate these diagrams using the online service http://yuml.me/. On the site you enter your model description using a fairly basic syntax. From then on the same diagram can be accessed using different URLs, which are used to control display and formatting options.
The diagram above was created using the syntax below. You can play around with this sample by clicking here.
[Hashtable]1..1->1[Class{bg:yellow}],
[Label ]0..1->1[Class],
[Style]0..*->1[Class],
[Class]0..*->1[Layer{bg:green}]
The class
diagram
on the left shows the properties of the MapServer Class
object.
Anyone can add
/edit/
to the URL path to make a new diagram based on this. A “clean” format of
the diagram can be seen here.
http://yuml.me/ has plenty of samples, but I couldn’t find full documentation on all the available syntax. As this is an online service you can never be sure when, or if, they might start charging. They do offer a download including sourcecode ($50 for a single user) to install locally so you can avoid paying a per diagram charge.
In response to the accusations that UML is evil http://yuml.me/ responds:
UML is evil when you use it too much for your given project; it’s easy to burn hours and hours doing UML stuff when you could be writing code or doing something more useful. Some projects use a lot of UML and that really helps them.
Sequence Diagrams
Next I wanted to make a simple to show the interaction between various parts of a MapServer and TileCache system I’ve been working on. For this I needed to create a sequence diagram that “shows how processes operate with one another and in what order.”
Scott Ambler at Agile Modelling thoughts on these diagrams are:
My advice is to only create a sequence diagram when you have complex logic that you want to think through ?” if the logic is straightforward the sequence diagram won’t add any value, you had might as well go straight to code.”
Whether or not my example fits into that category I’m not sure - this example was principally to test a different service. This time used I used the online service at http://www.websequencediagrams.com. The whole diagram generation process can be automated using Python - the script used to generate the diagram below can be downloaded here. Again by changing parameters in the URL you can change the “scruffy” appearance to a more clean style depending on the diagrams audience for example a more formal version could be included in a bug report, and a more colourful version in a user wiki.
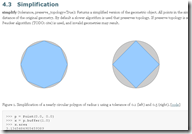
Shapely
Sean Gillies has just finished documenting the Shapely a “Python package for manipulation and analysis of planar geometries.”
The first impression you get is that it’s attractive. The images of geometry (generated by the Python package descartes) catch the eye, and it was these images as much as anything else that led me to trying Shapely in the first place.
The documentation also has plenty of code samples ?” which as any developer knows is by far the easiest way to start using a new library or framework. If you can combine writing code samples with generating nice diagrams for a user manual then no wonder he is:
Hit F5 and let the computer do the work.
- orphan:
Comments
1. Eric R. **
programmatically, using VBA? | Is there a method such as schemaLock.ReleaseAll?
Thanks, –Eric
Reply2. geographika **
the .mdb file, I don’t think it would be possible with VBA code. | You can use code from http://support.microsoft.com/kb/198755/EN-US/ to find a list of users connected to the database and if they are in a suspect state. | Failing all else you could write code to delete the .ldb file, but this may cause more problems than it solves.
ReplyAdd Comment